New York
Emotions
The day’s reading.
The people in the room.
What changes
when you ask?
For about a month leading up to New York City’s 2025 mayoral election, public search activity became a daily reading of emotion. Days before the election, the project brought that reading into a room and asked people how they felt.
A reading,
once a day.
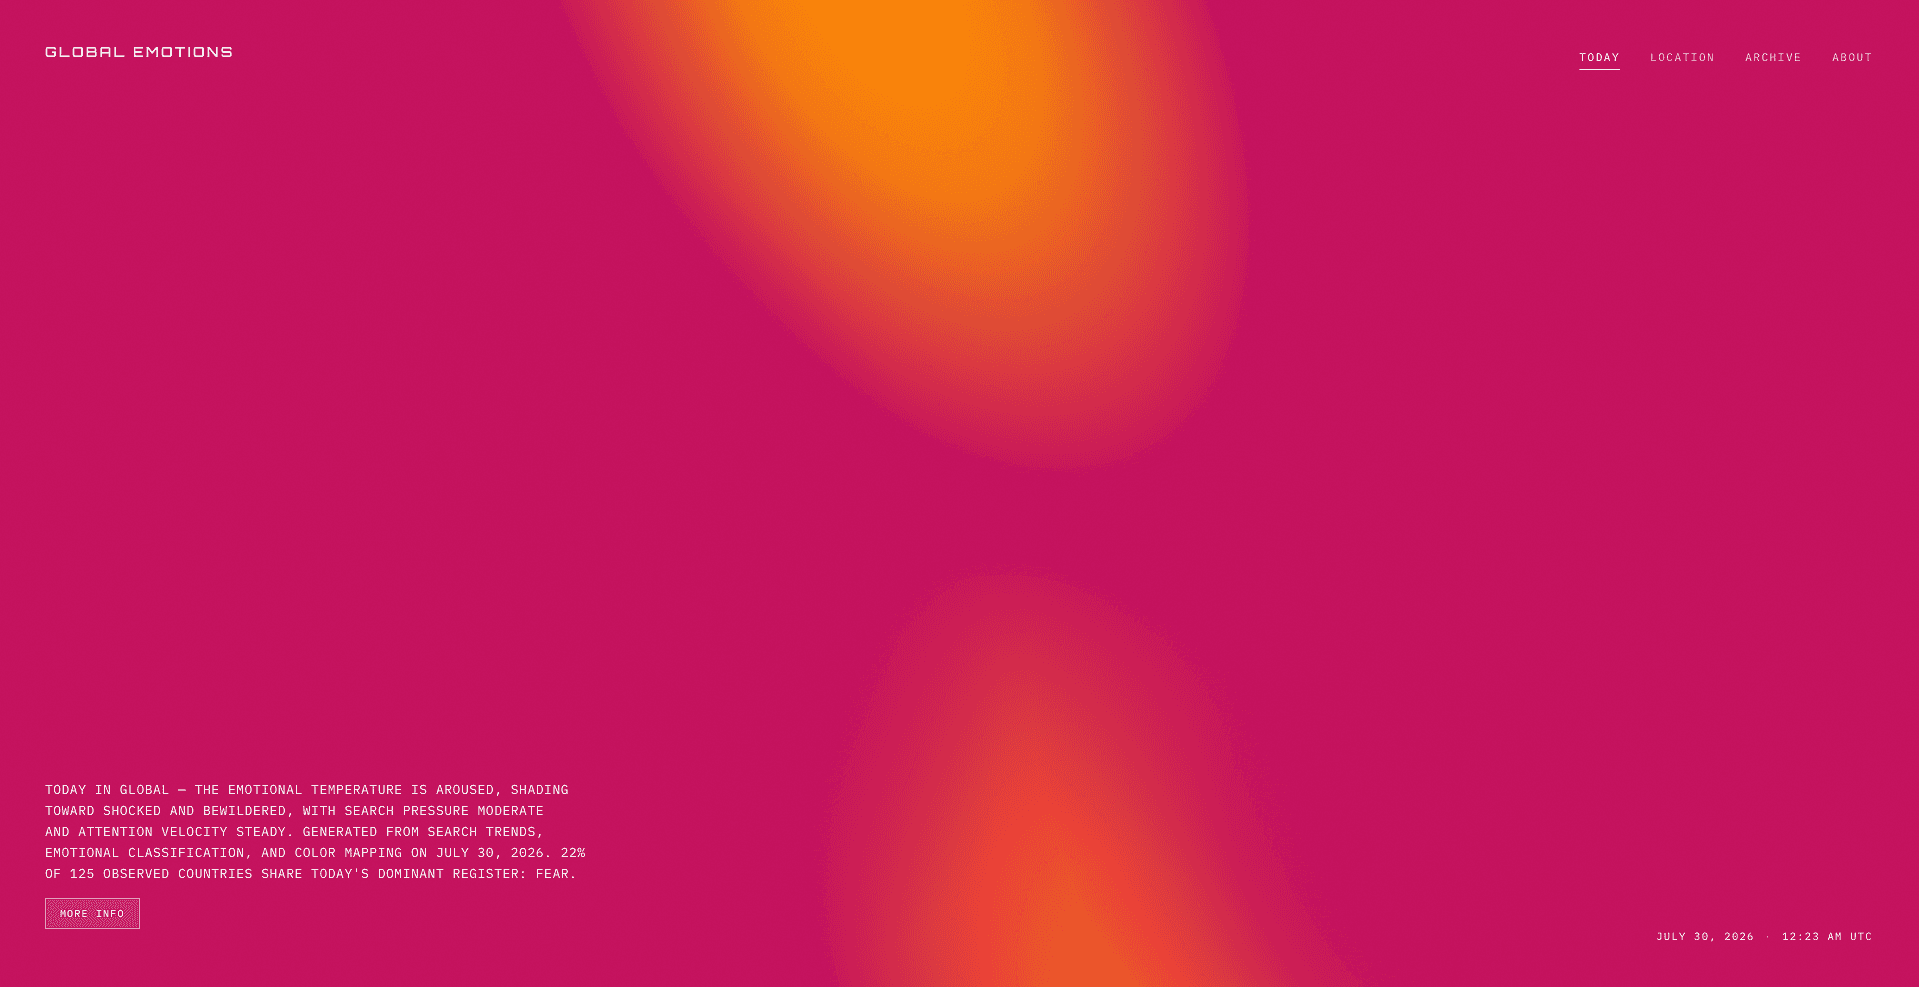
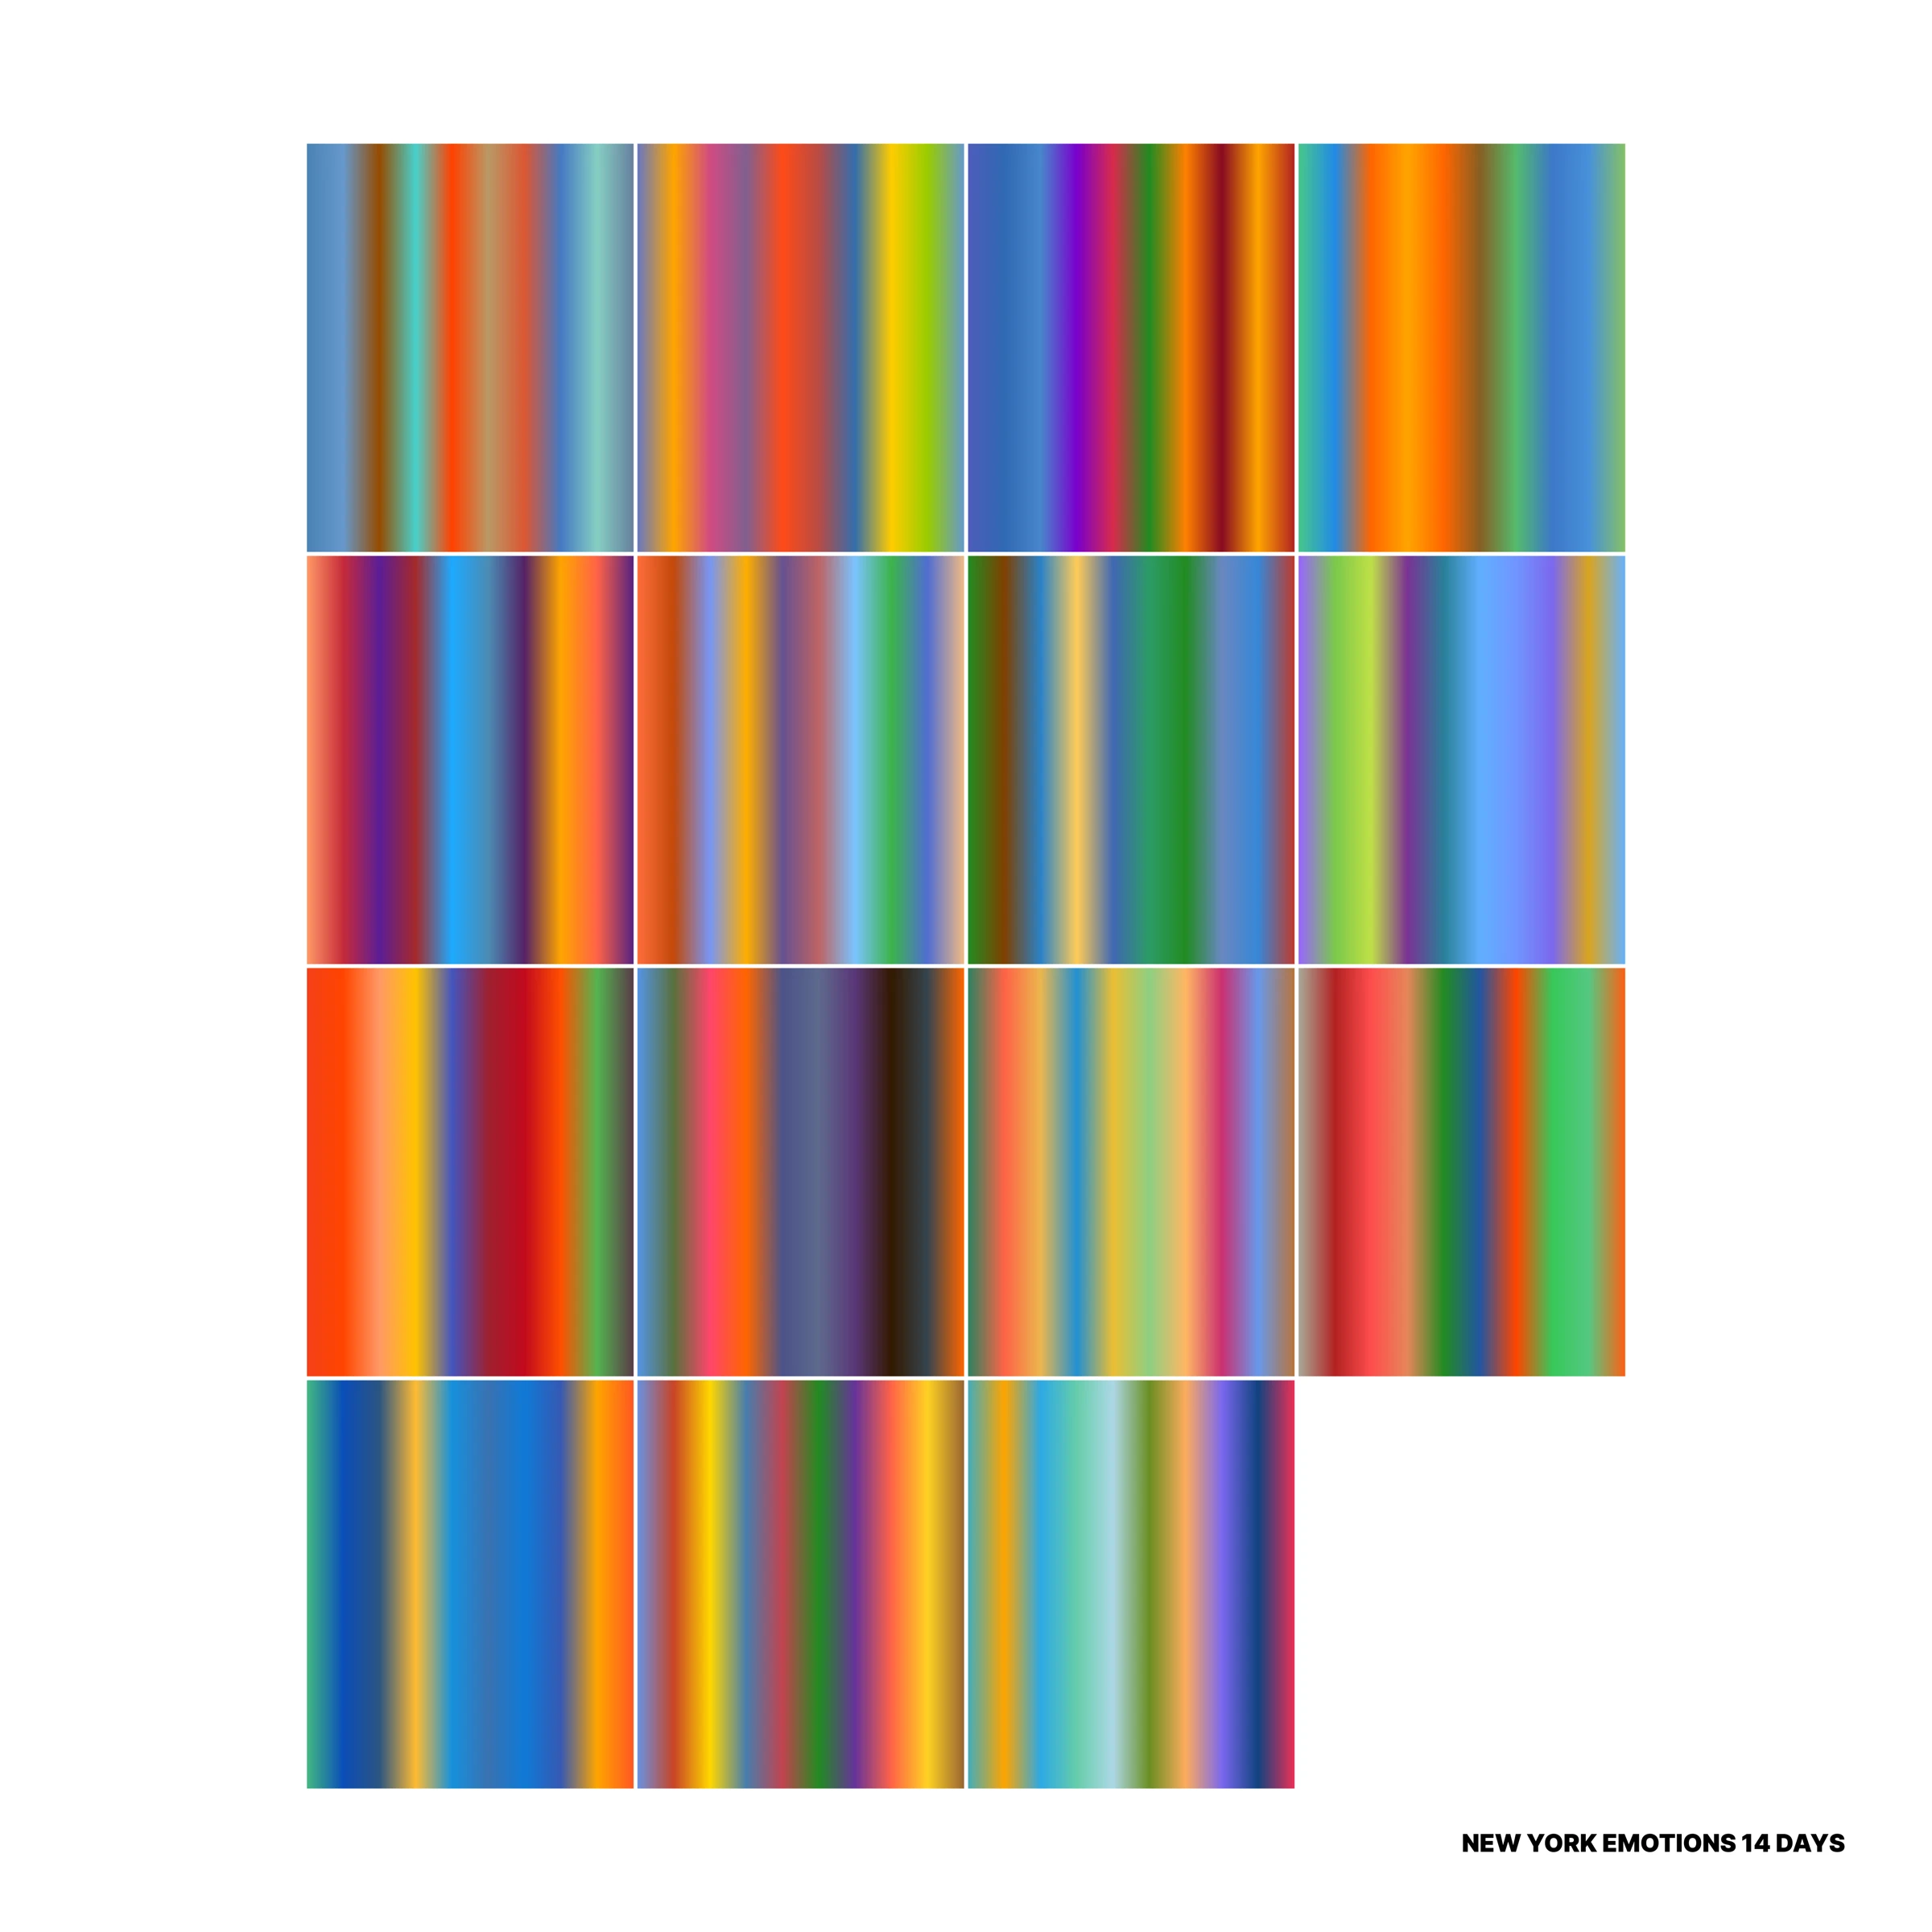
Like American Emotions, the work began with public attention. A daily collection of search trends passed through an authored interpretation of emotion and color.
Each field held the system’s reading of those signals. New York Emotions asked how that reading would sit beside the feelings of people encountering it.
“How are you
feeling right now?”
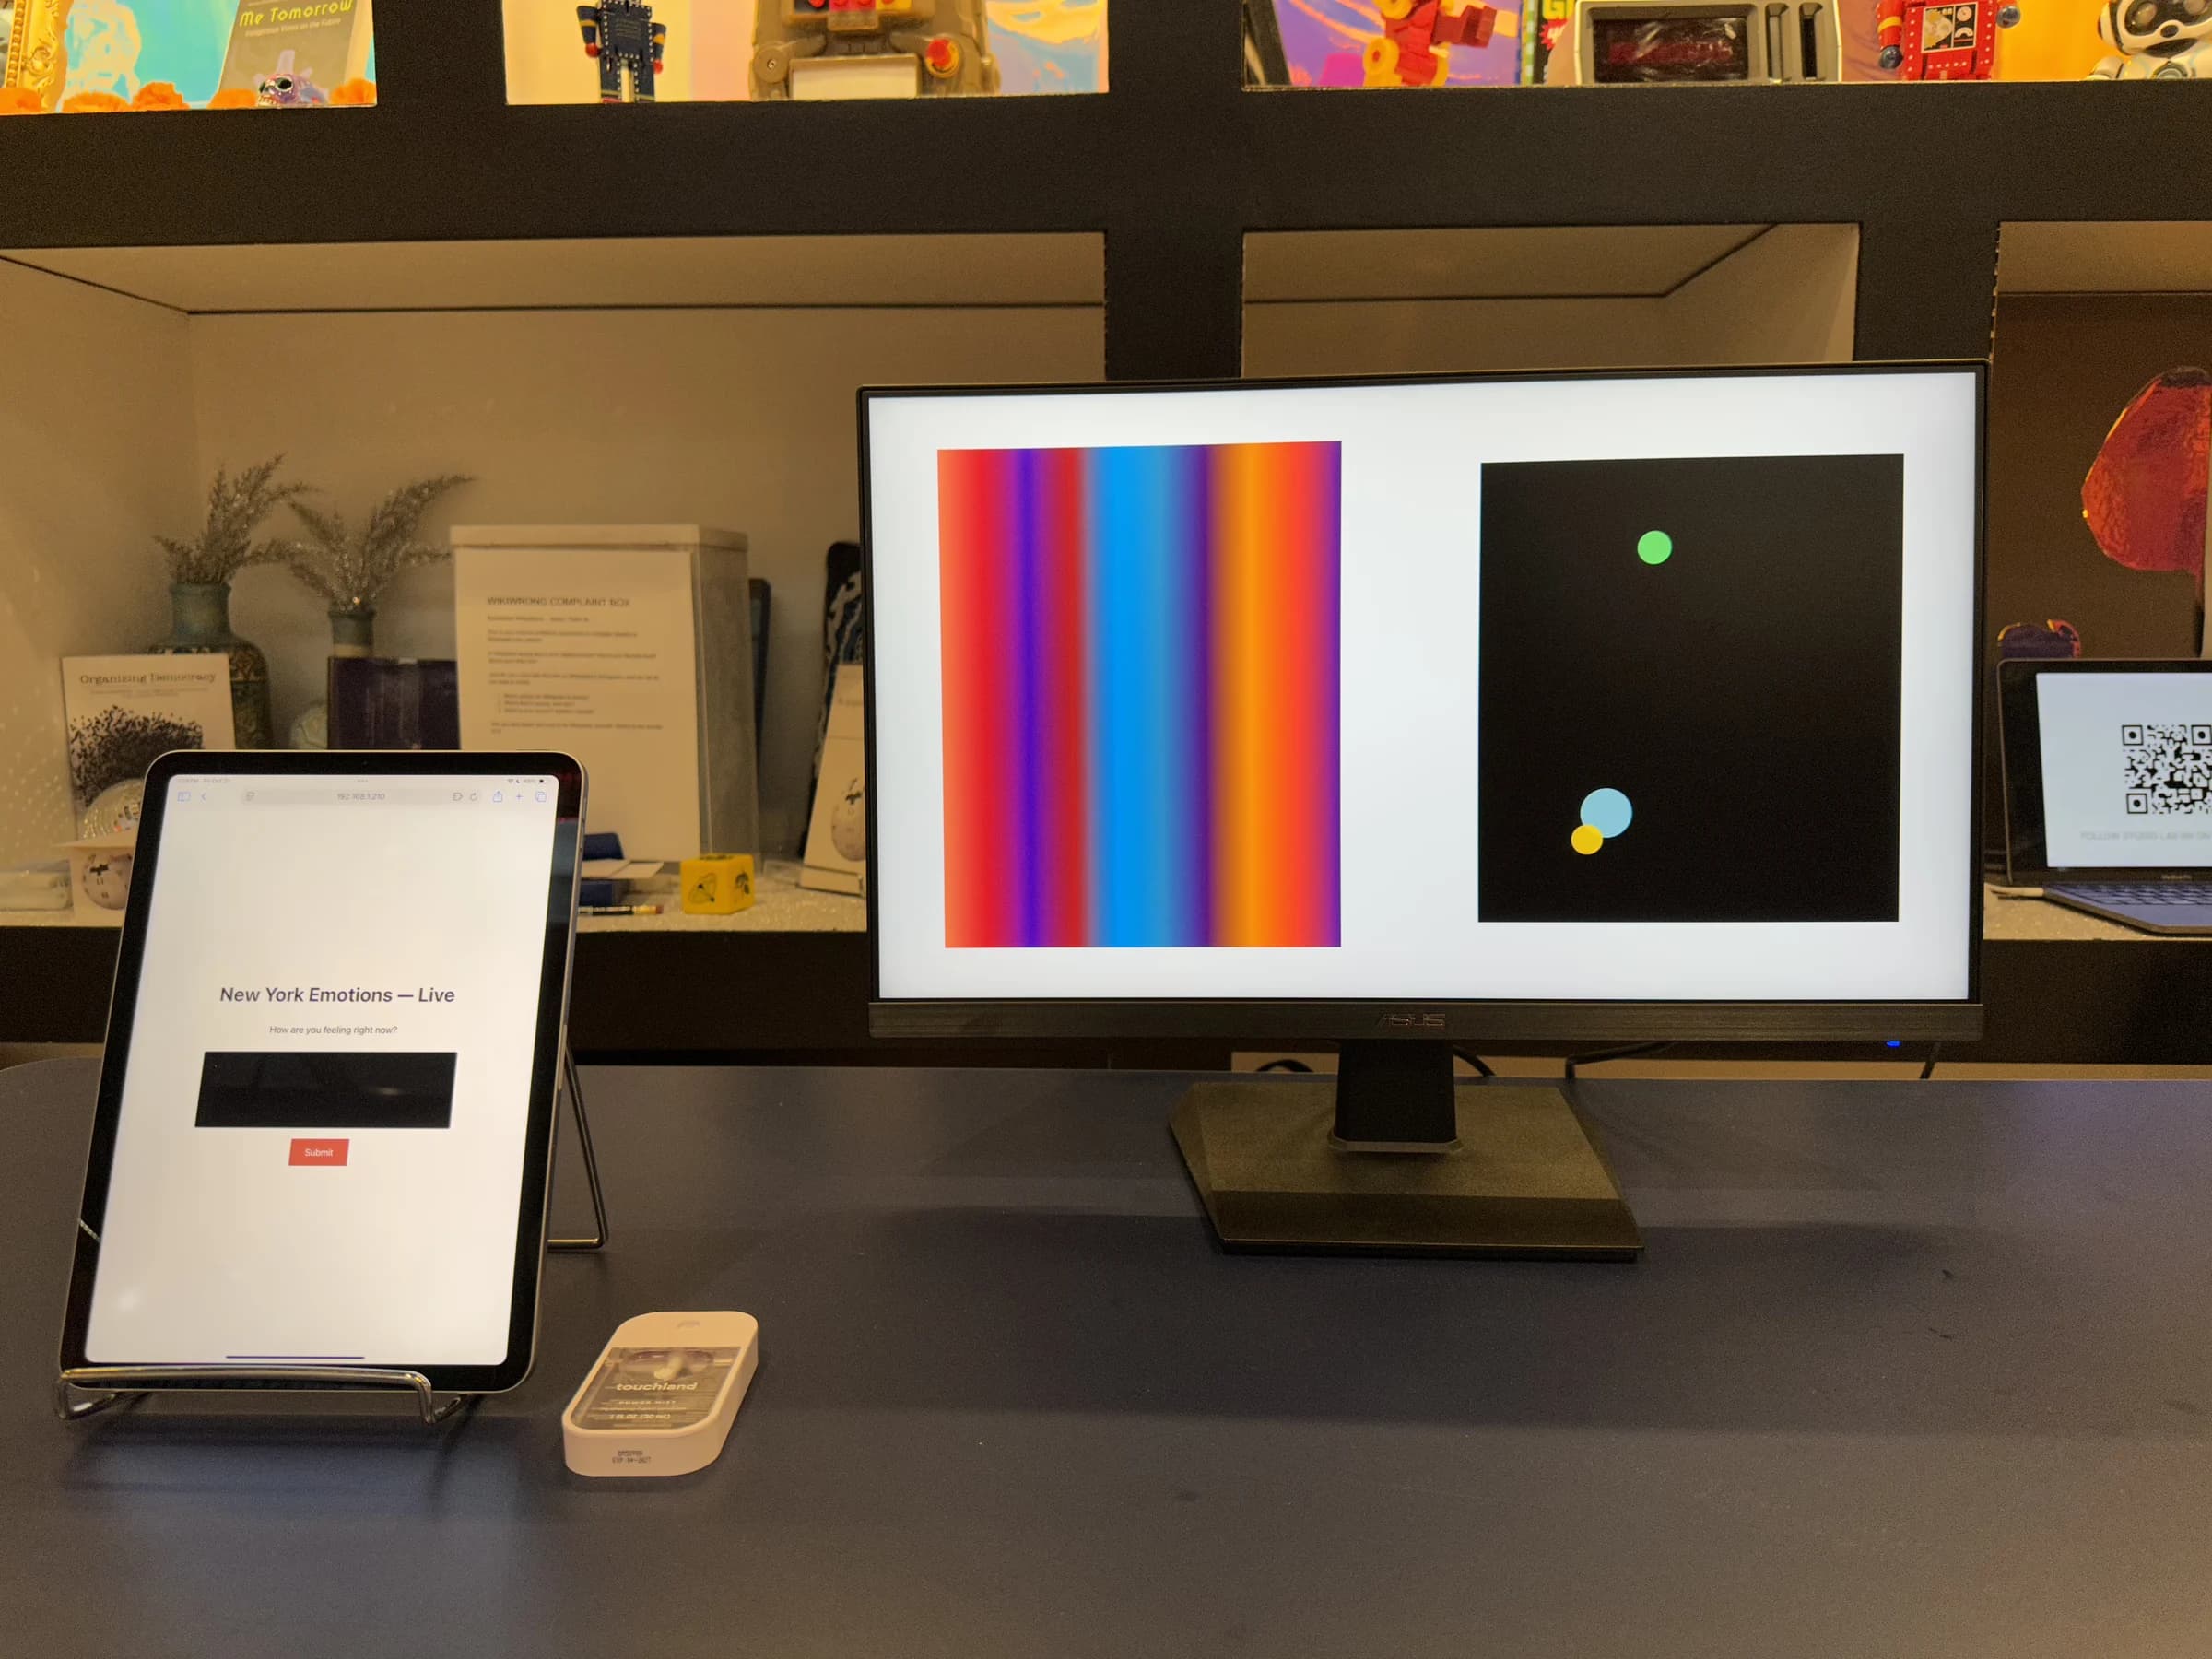
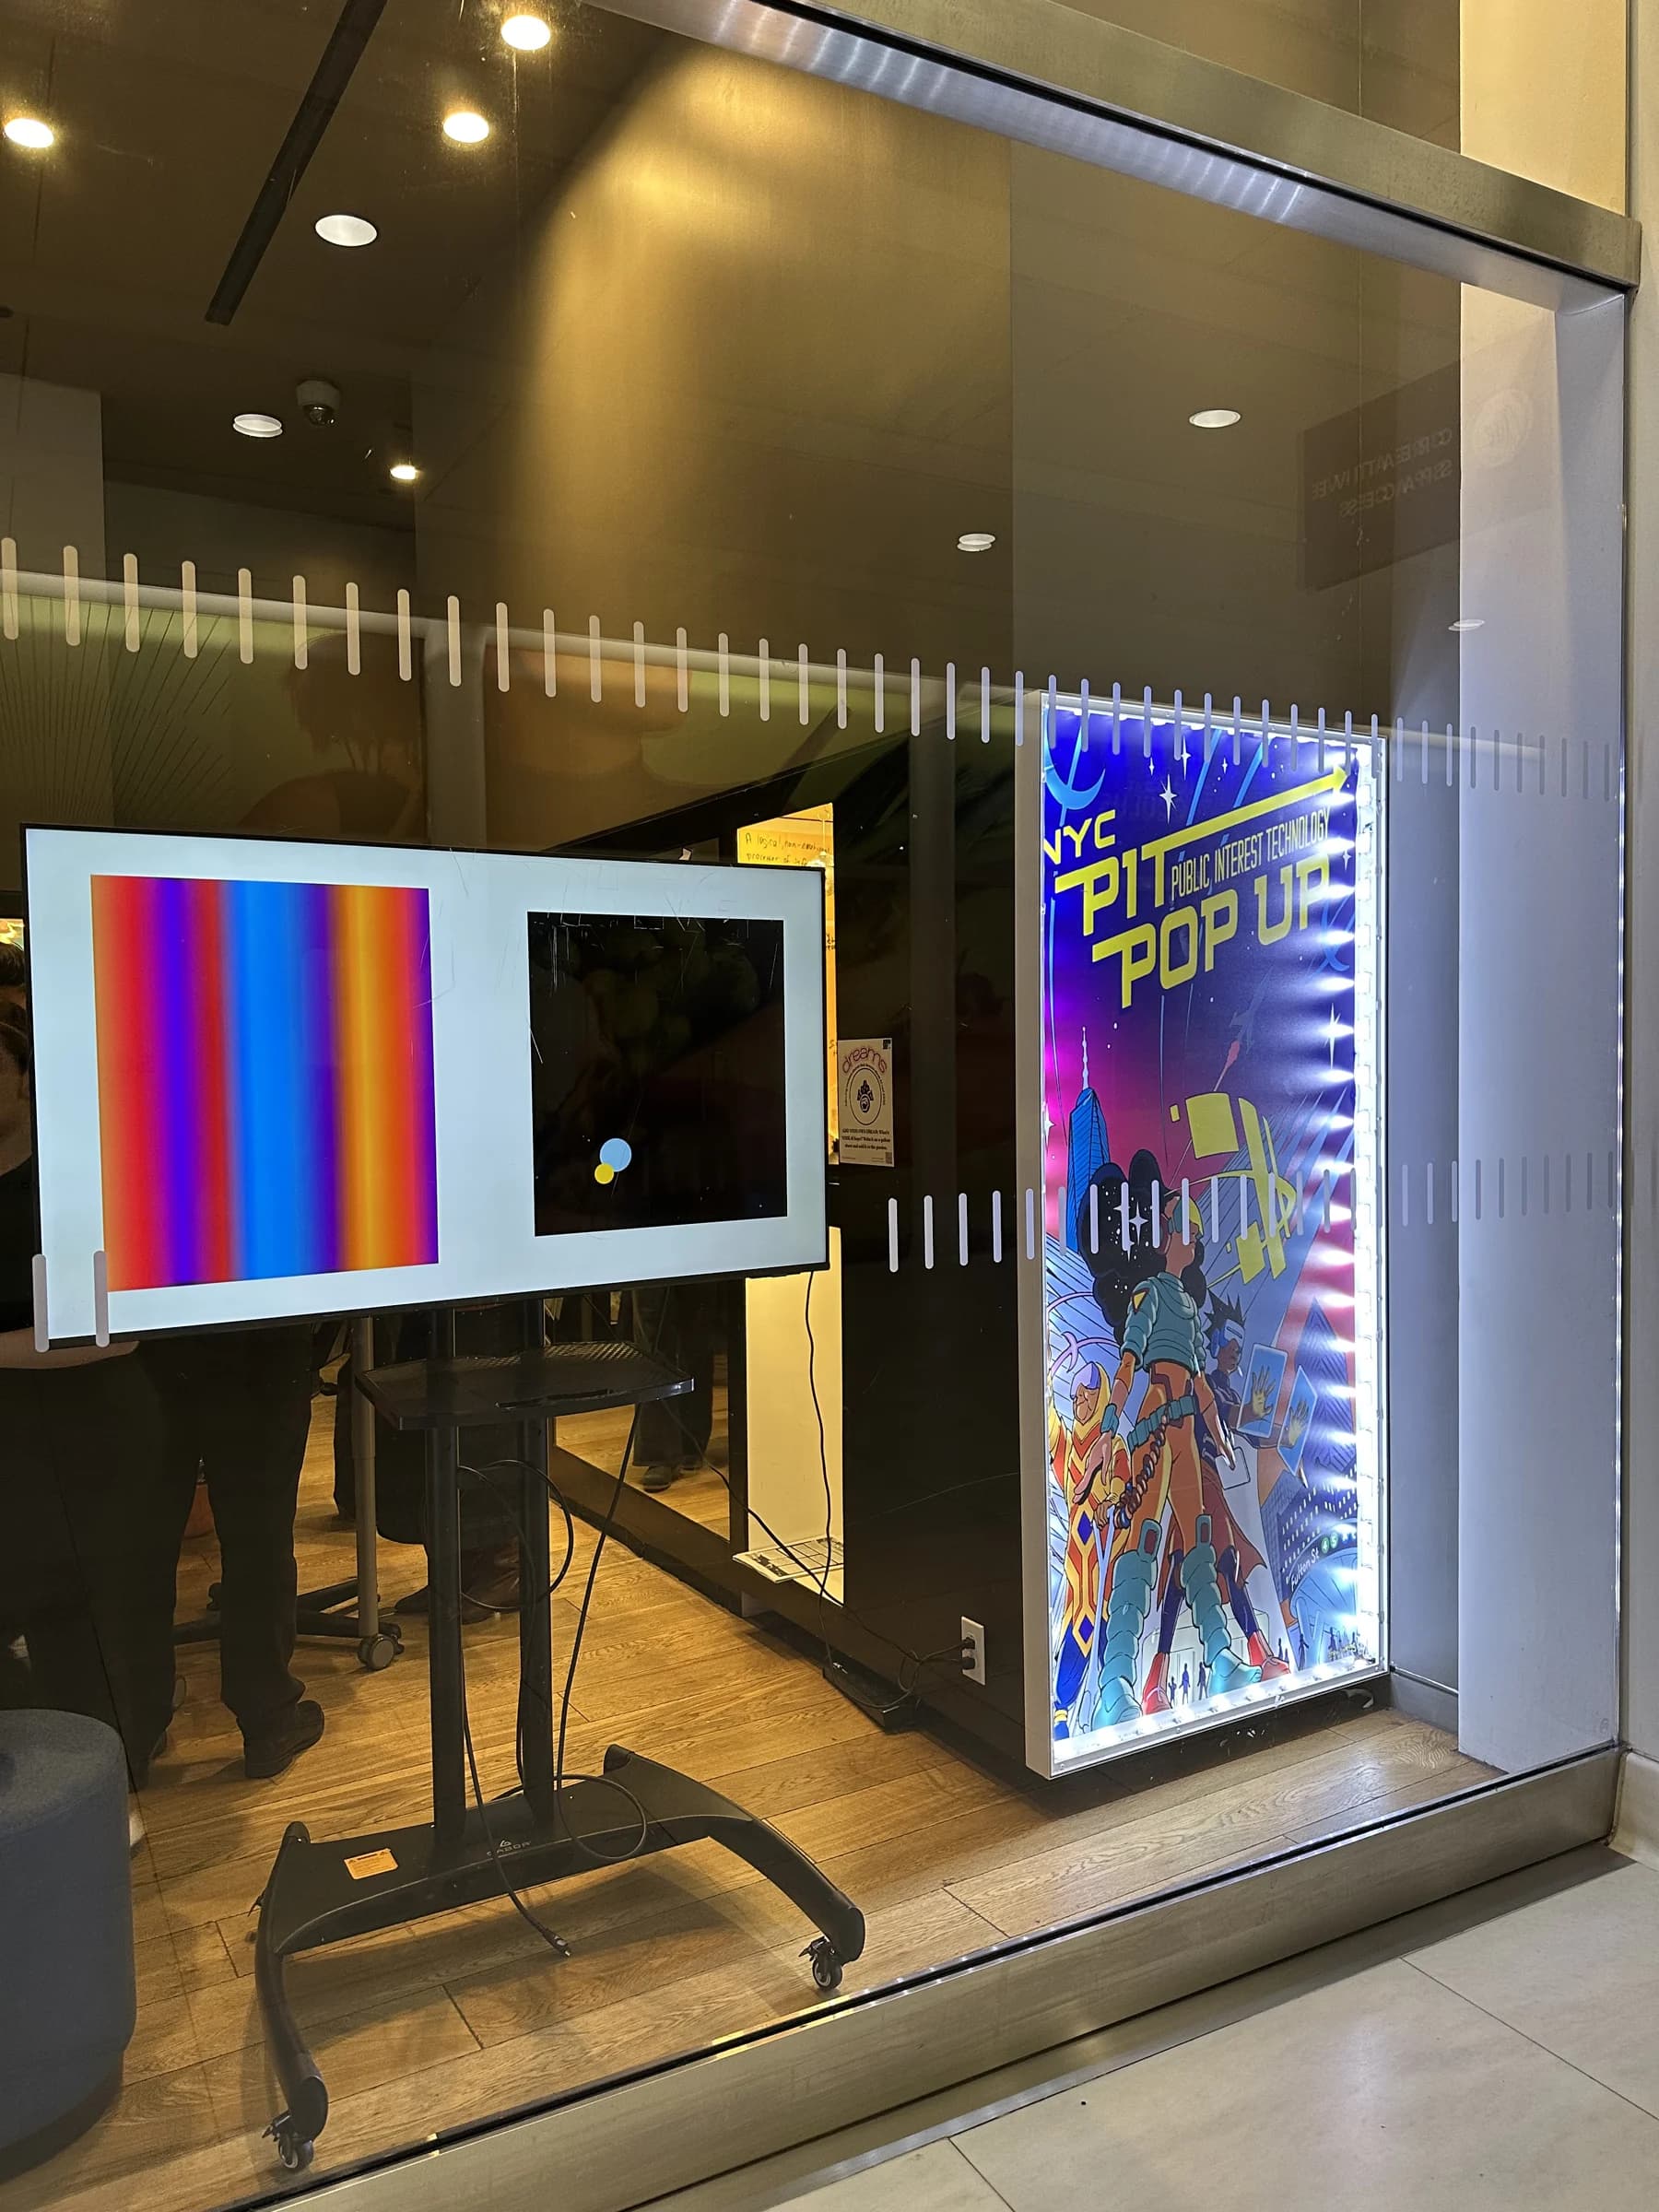
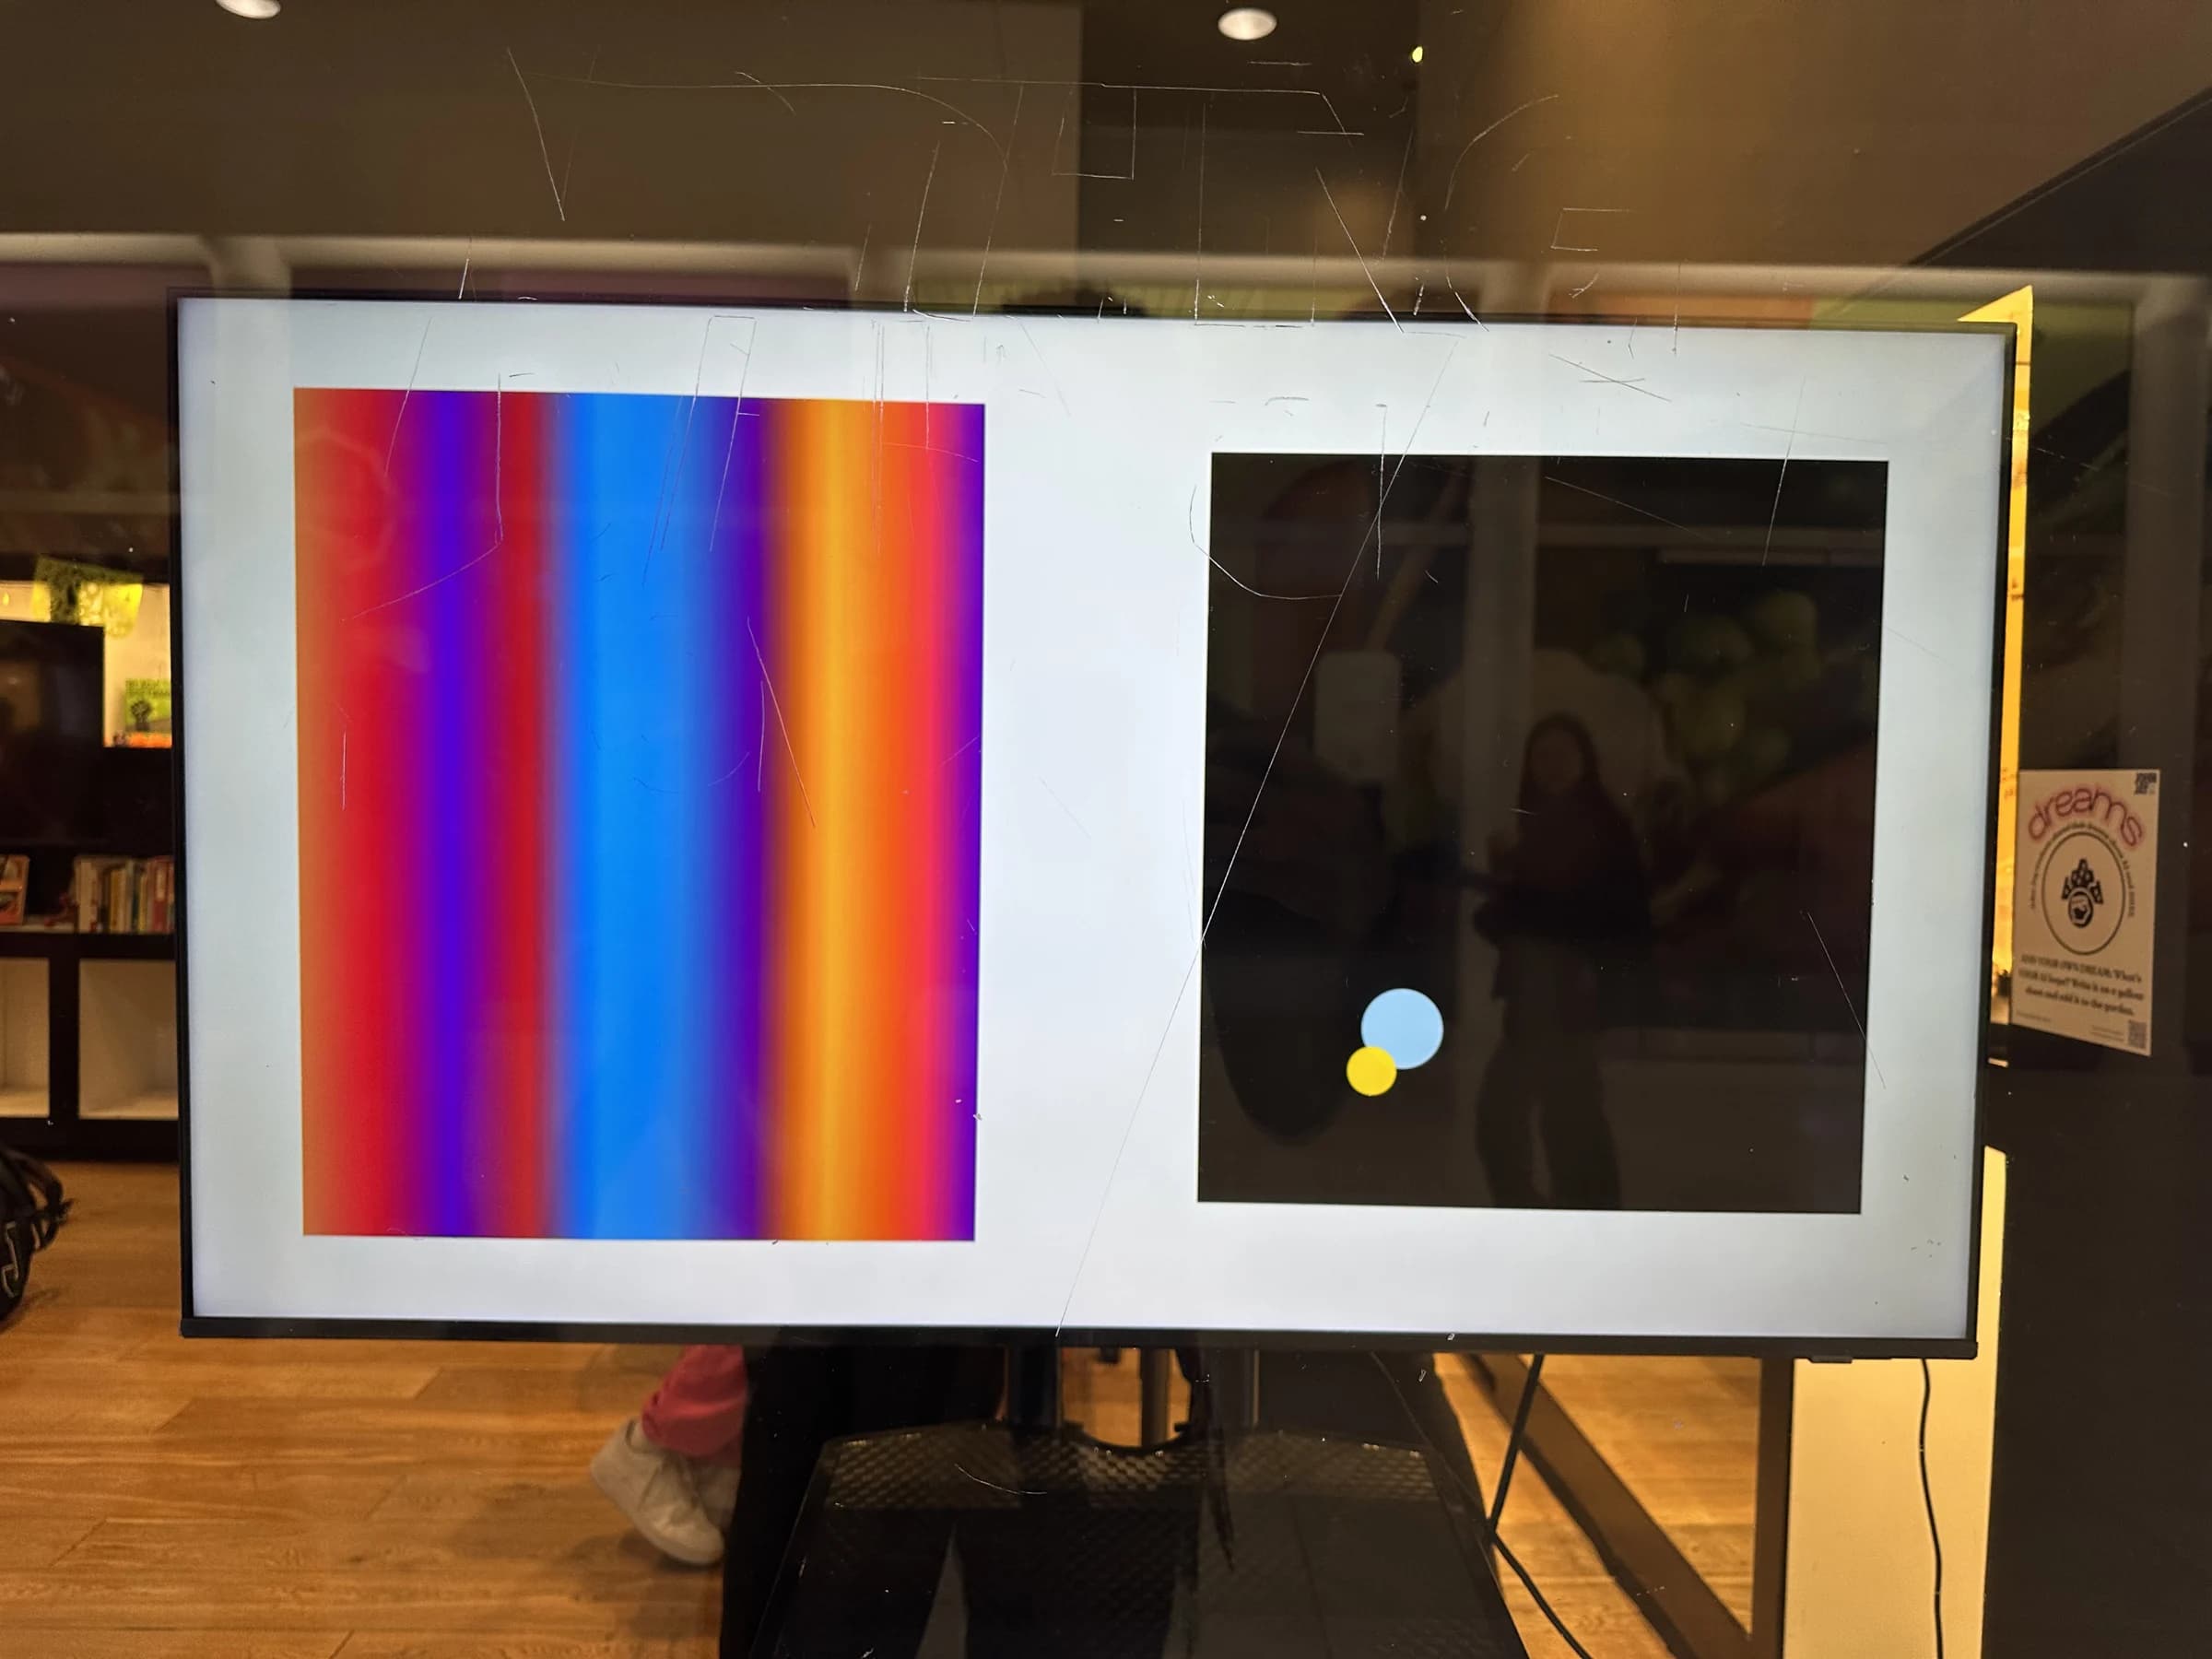
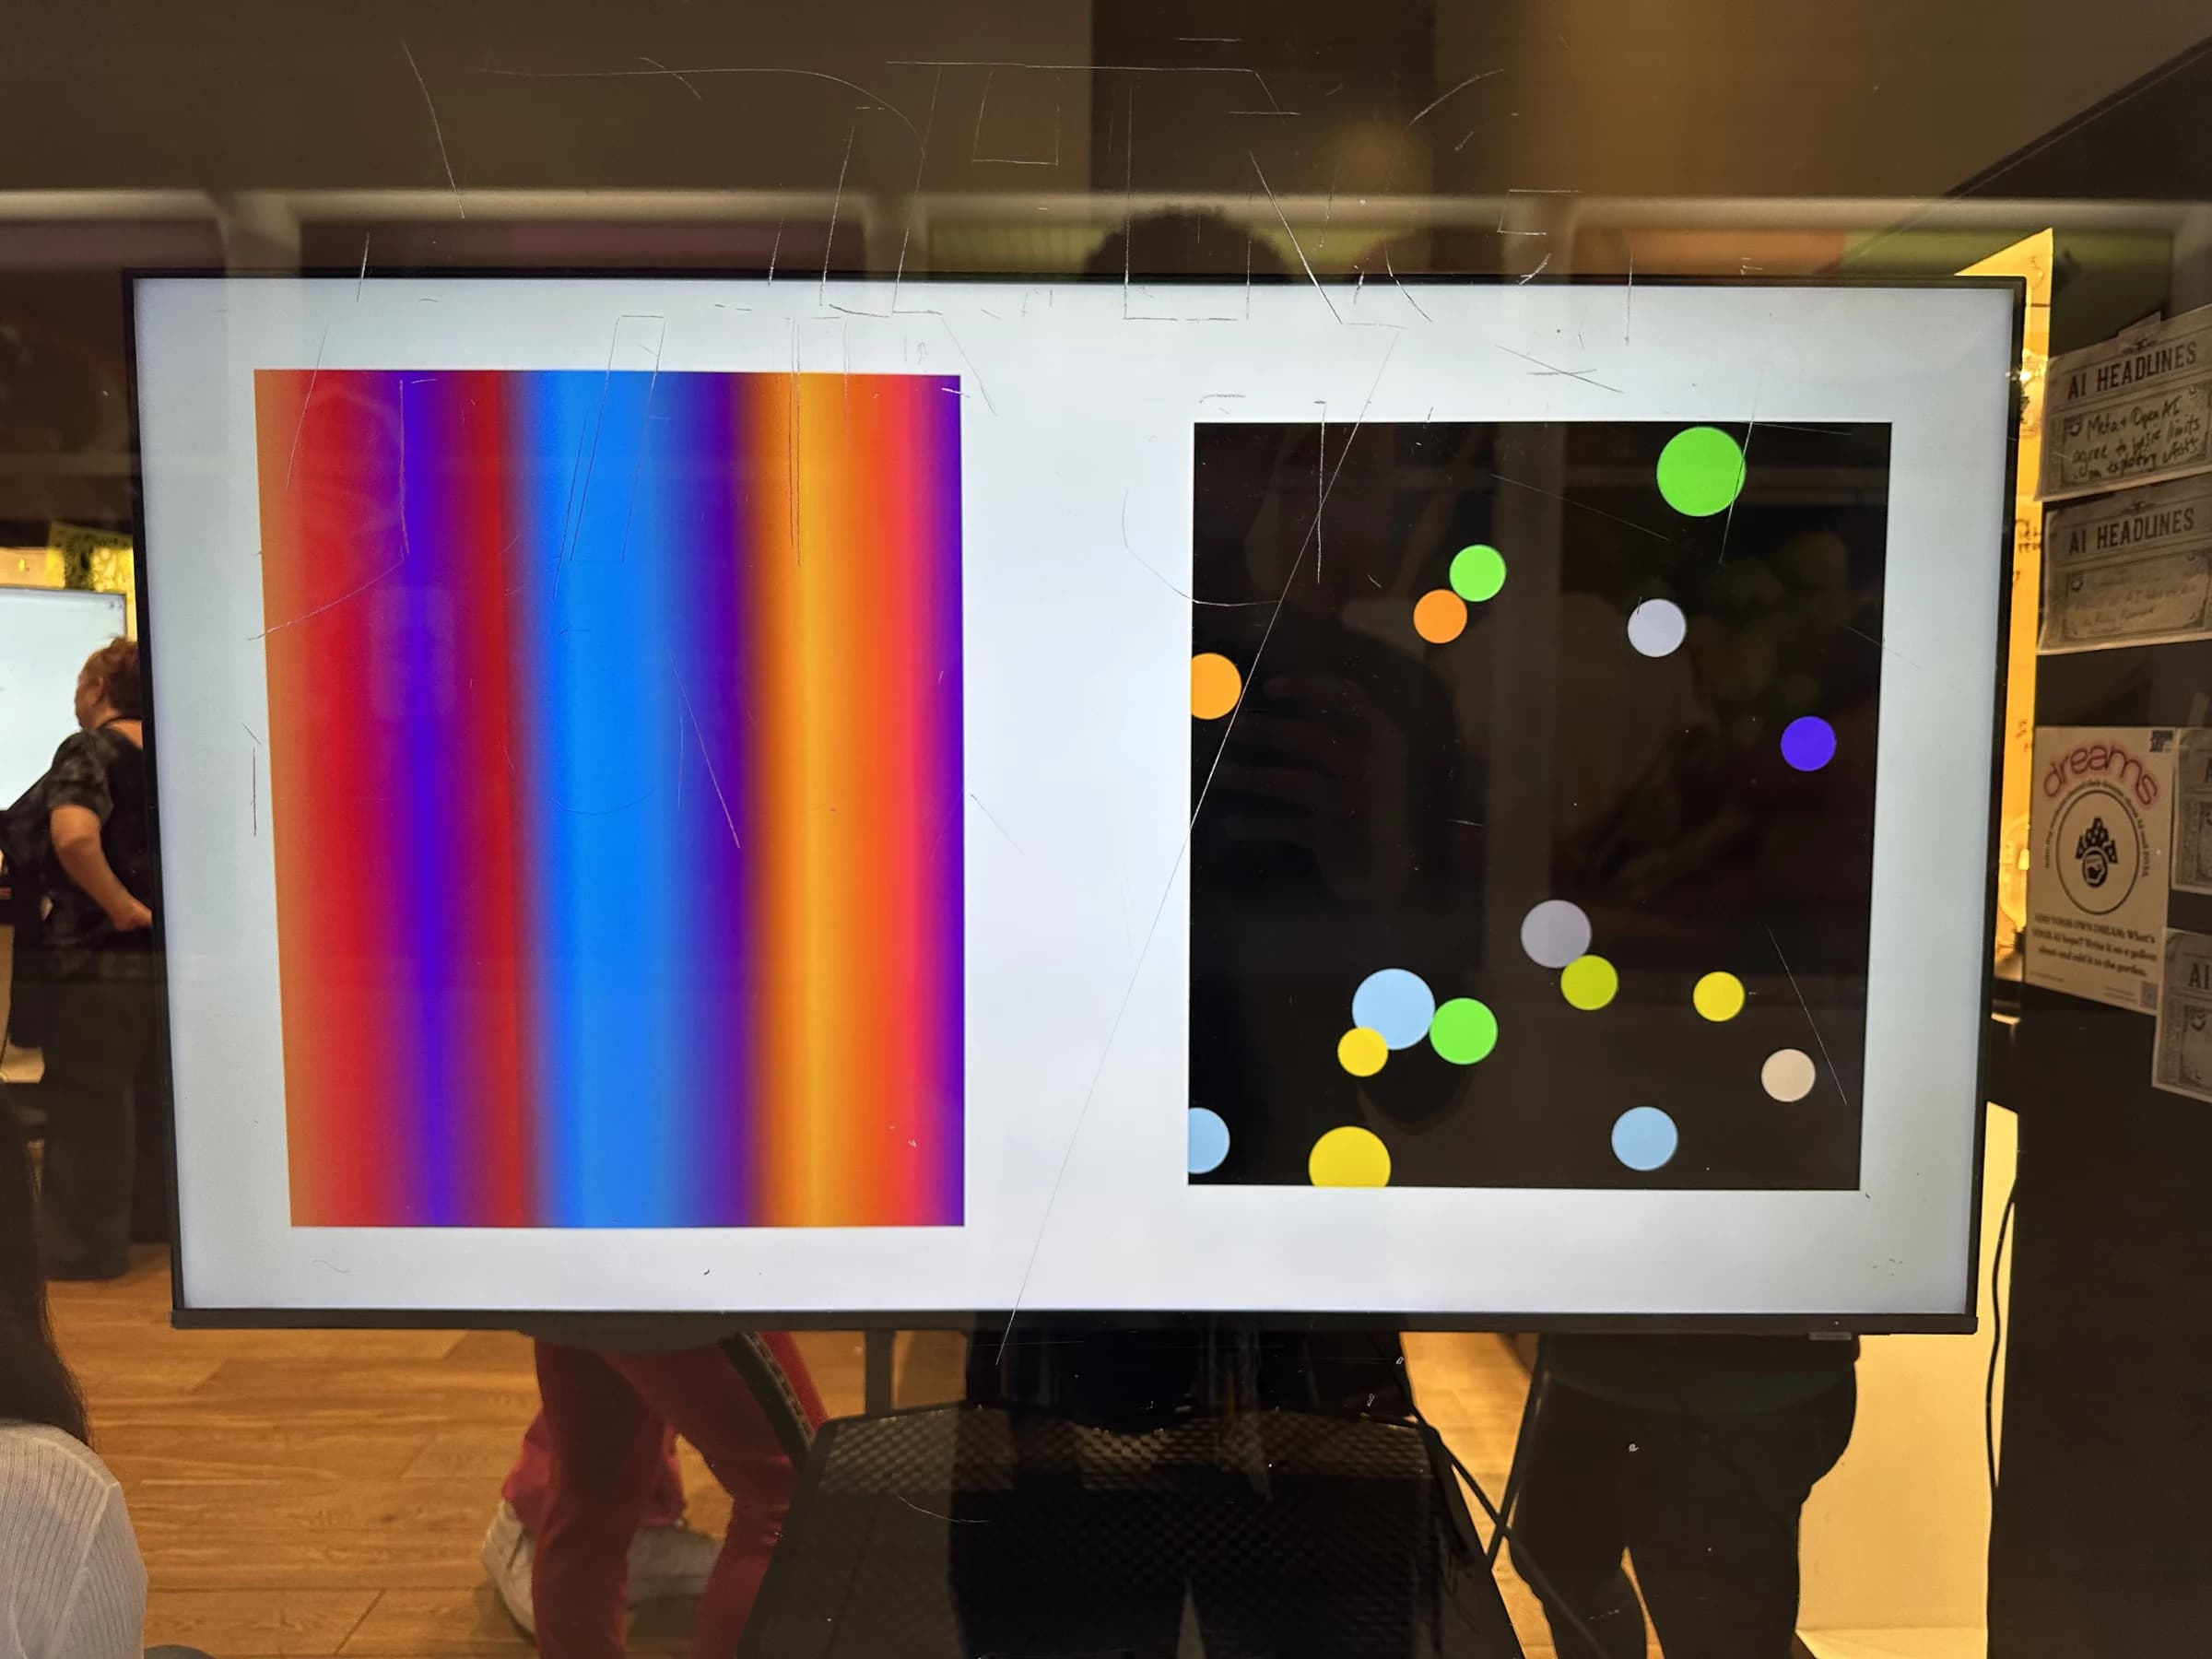
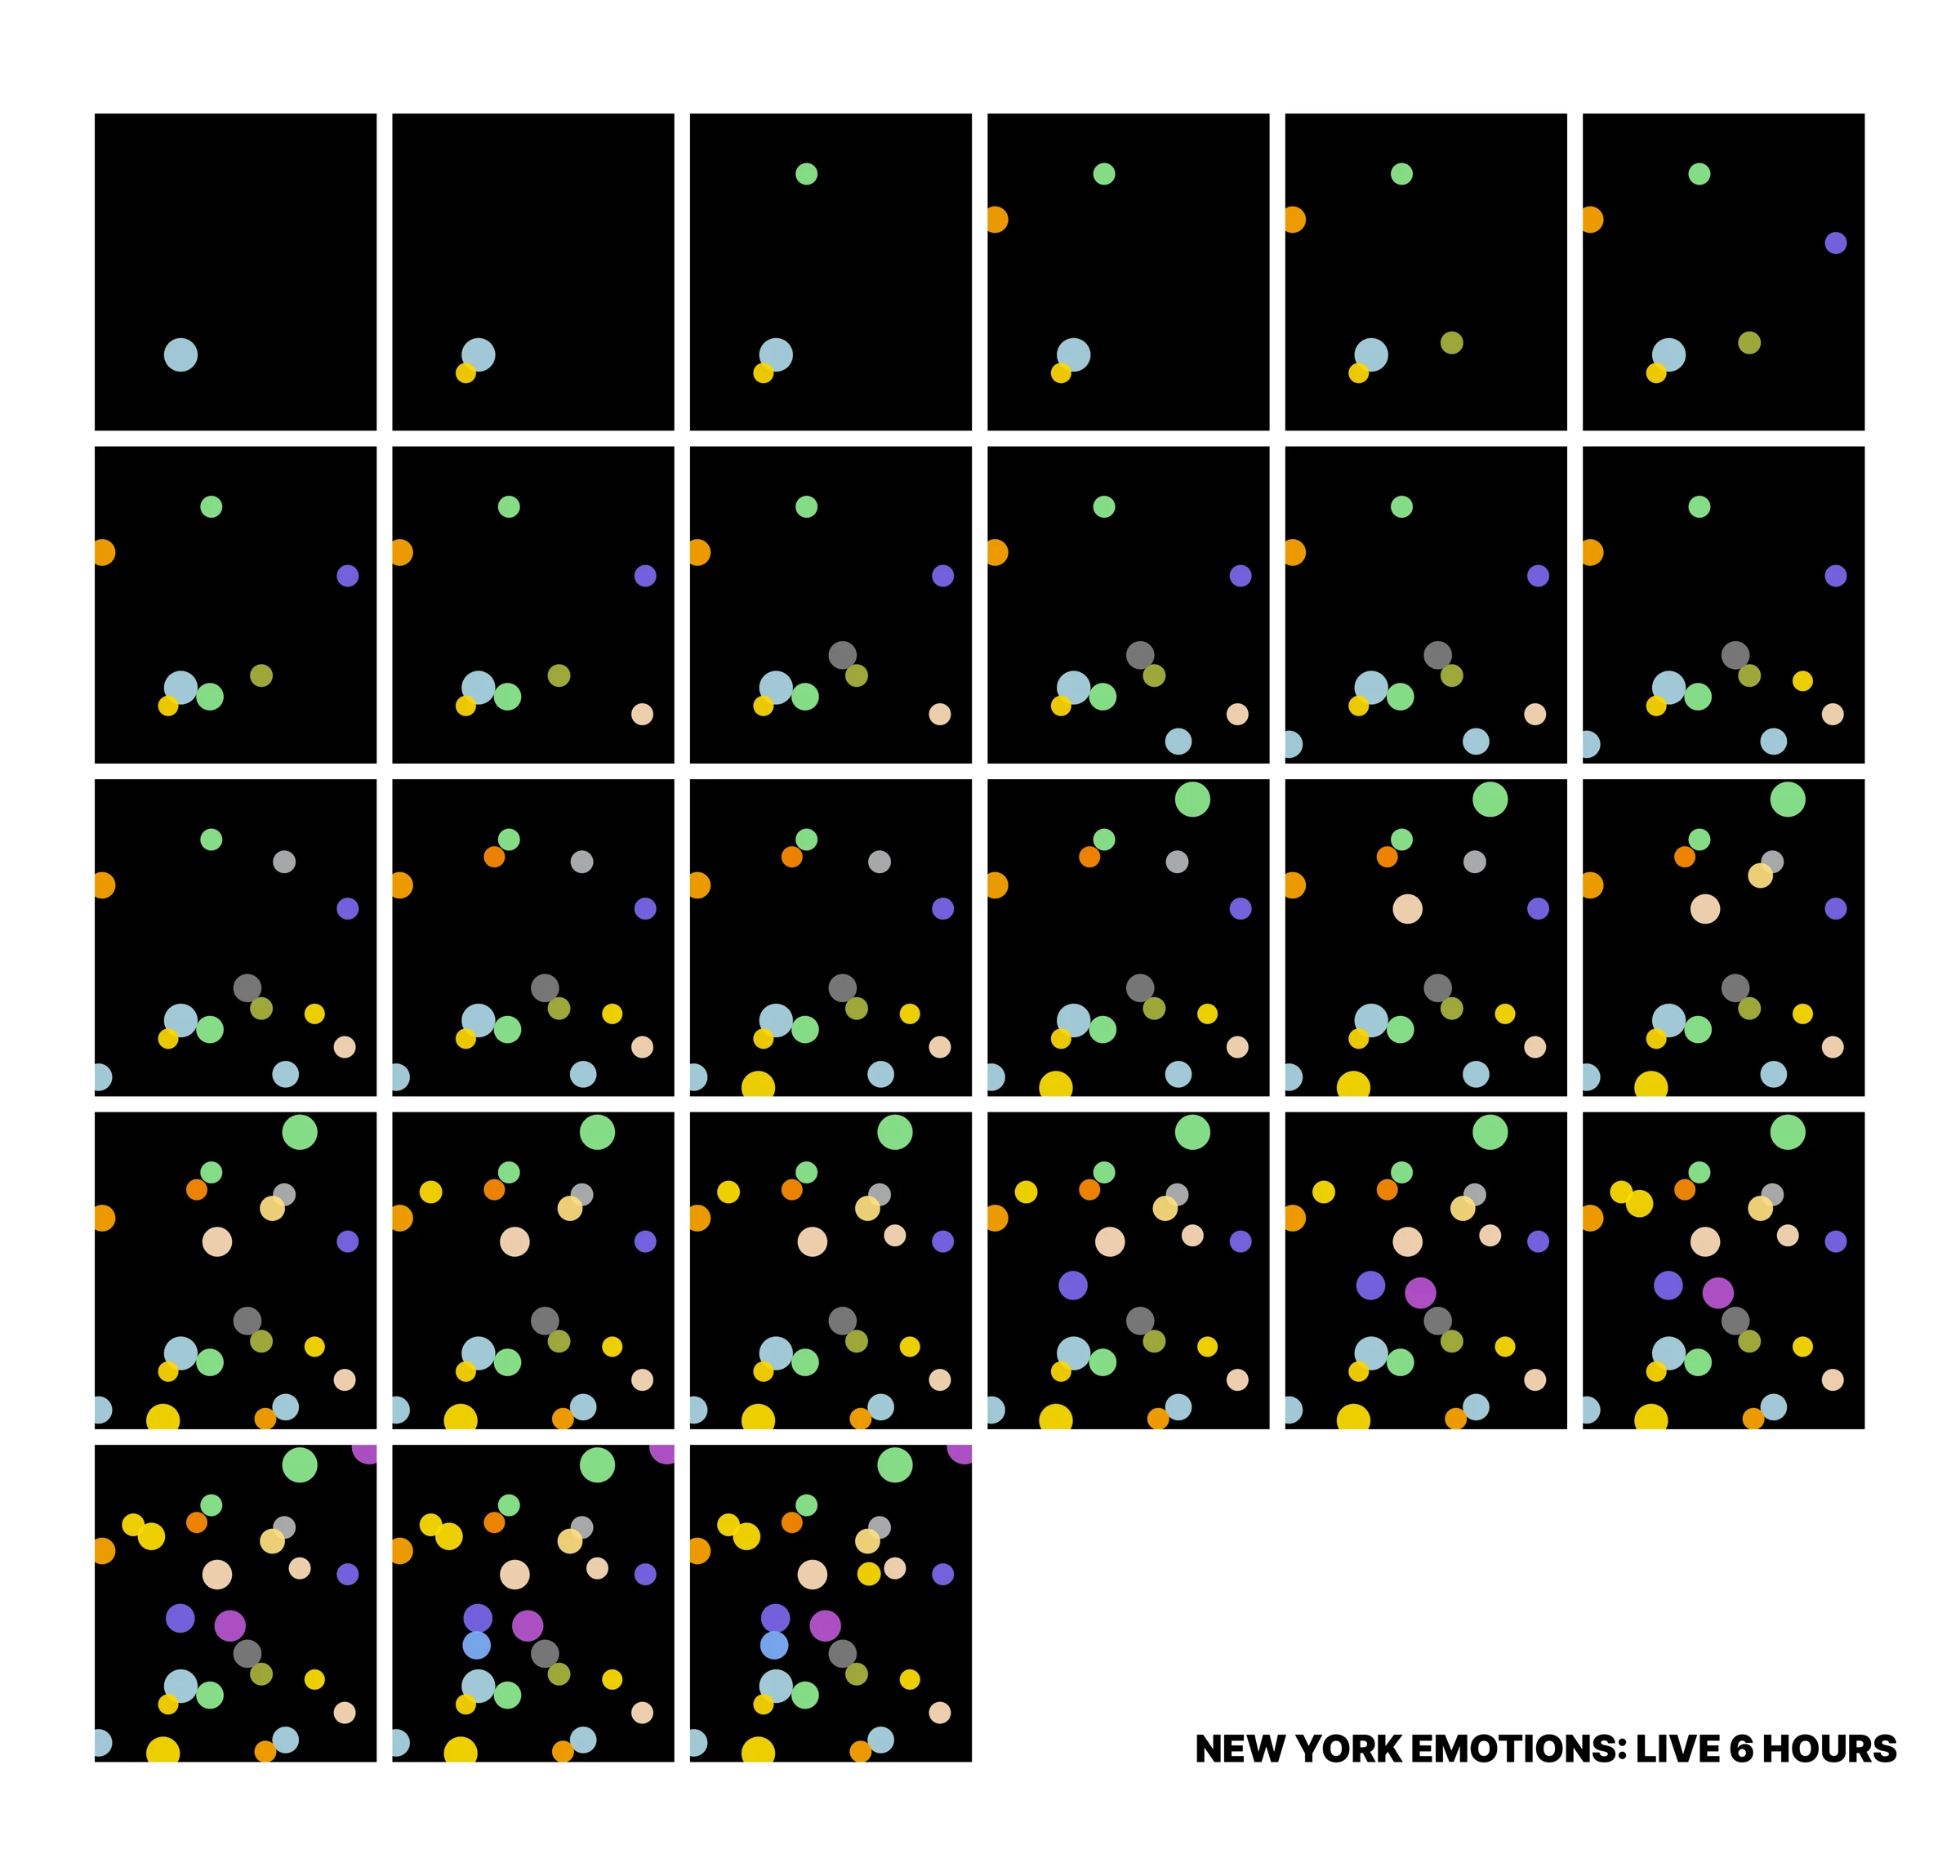
At NYC PIT Pop-ups, visitors answered this prompt on an iPad. Their responses became colored blips on a shared screen, joining those of people who had already taken part.
For six hours, the display grew. The day’s inferred field remained alongside it.
One day.
Many moments.
The daily field and the live responses move at different speeds. One is a reading of public attention; the other accumulates from people describing a moment in their lives.


More than
one feeling.
Four of the 27 archived submissions. Each person’s words could hold several feelings at once. The system gave each response an emotion label and a color.
“Hopeful because a candidate with fresh policies is popular and isn’t held back by his religion and race”
“I’m anxious but happy”
“I’m excited but also tired from, midterms. I am thankful and happy about the opportunities I’m given to explore!”
“Exhausted and burnt out but still a little hopeful a better world is possible if we build it”
The comparison
became the work.
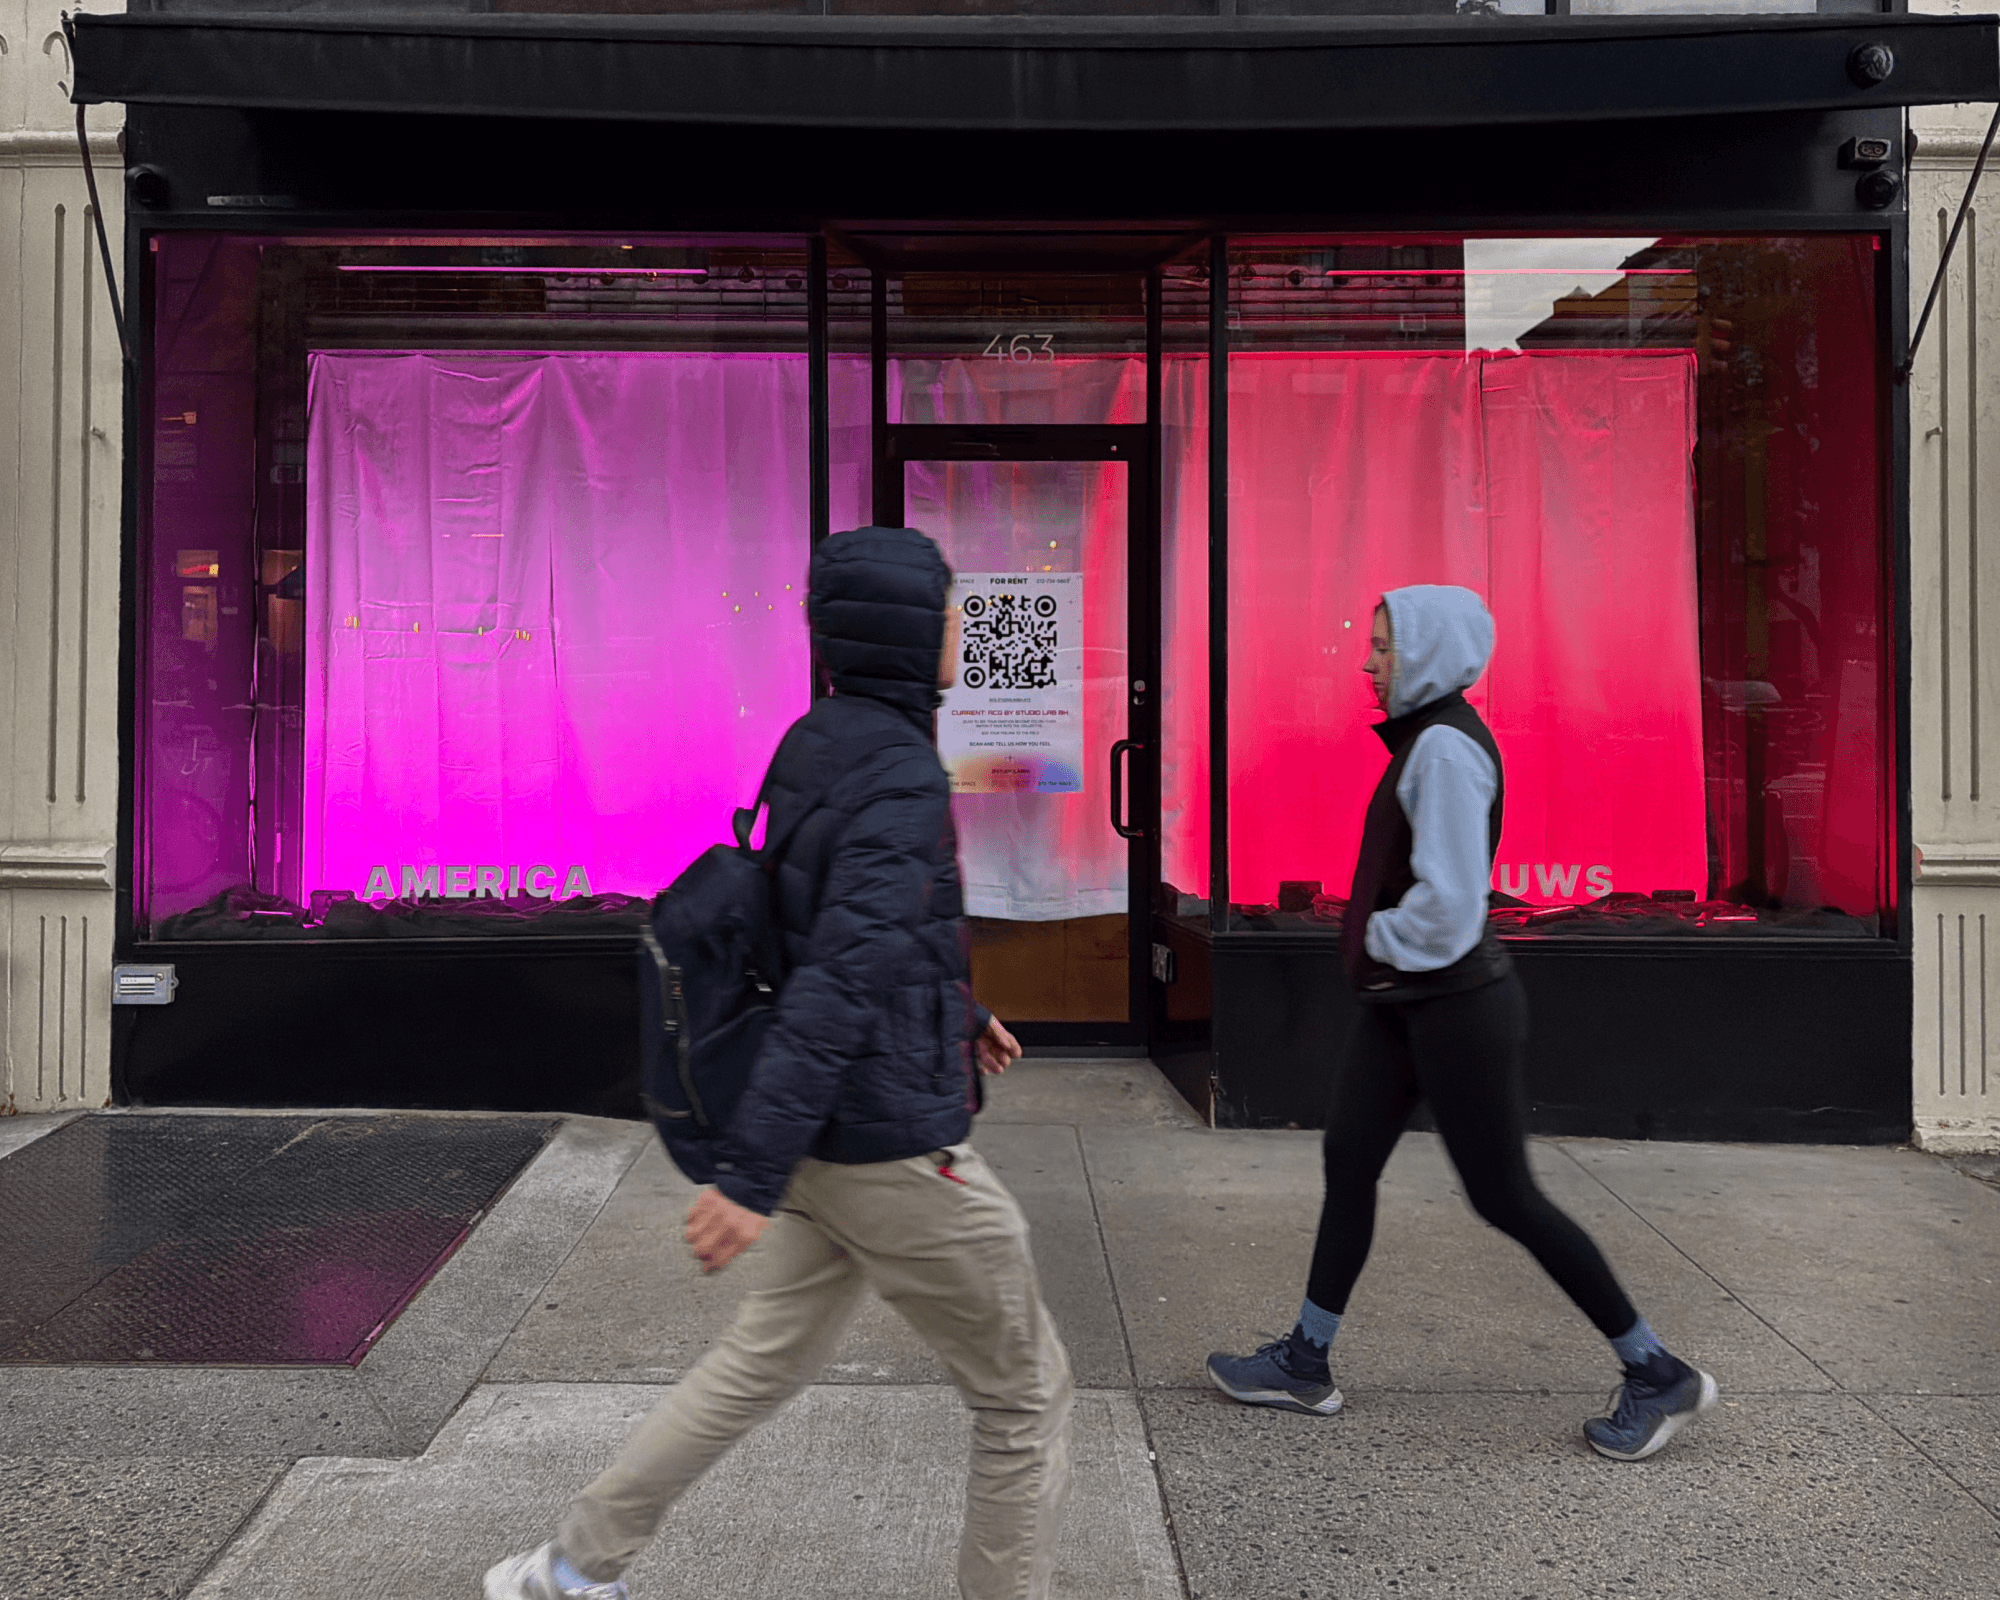
New York Emotions was the first point in this inquiry where an inferred emotional state met people speaking for themselves. That question led directly to Tell Me How You Feel: ACG, carrying the comparison into a shared environment of light.
Project details
- Period
- 2025 mayoral-election period
- Location
- NYC PIT Pop-ups, New York
- Form
- Instrument / participatory study
- Duration
- About one month / six-hour live study
About the project
A daily interpretation of public attention meets six hours of people describing how they feel.
New York Emotions ran for about a month leading up to New York City’s 2025 mayoral election. It brought the inquiry of American Emotions into a shorter period and a local political context, using public search activity to produce a daily interpretation of emotion through color.
Days before the election, a six-hour study at NYC PIT Pop-ups added another source: people present in the room. Visitors responded to an iPad prompt, and each response appeared as a colored blip among those already contributed. The growing field was displayed beside the day’s inferred reading.
This was the first project in the series to put the system’s inferred emotional state into direct conversation with what people said they felt. That comparison led directly to Tell Me How You Feel: ACG.
Two sources, two timescales
The daily reading
- Public search trends collected once a day
- Emotion labels and colors assigned within the system
- A daily field of vertical color bands
The live responses
- A visitor responds to “How are you feeling right now?”
- The response receives an emotion label and color
- A colored blip joins the shared display
The daily field remained beside a participant field that grew as responses arrived during the six-hour session. Their different timescales were part of the comparison: a daily interpretation of public attention and immediate descriptions of feeling.
The live input begins with a person’s own words. Its appearance still passes through a system that selects a label and color. A response containing several feelings can become a single blip.
Scope of the public signal
The retained search data uses Google Trends’ US-NY feed, which is scoped to New York state. The city’s mayoral election supplies the project’s context; the feed also includes sports, entertainment, and other public interests.
From a response to an interpretation
The response archive contains 27 submissions, each with text, an emotion label, and a color. These are submission records; the file does not identify distinct participants or include timestamps.
The quotations on this page retain the wording of the submitted text. The labels and colors beside them are the recorded interpretations.
The comparison opens a question about the system itself. A visitor speaks from their own experience, while a model interprets a public signal. Both then pass through decisions about how emotion should be labeled and rendered.
- What is lost when several feelings become one color?
- How does a daily interpretation relate to a feeling expressed in the moment?
- What can agreement or difference between these two fields tell us?
From New York Emotions to ACG
American Emotions, and later Global Emotions, develop autonomous systems that infer emotional states from public signals. New York Emotions opened a participatory line of inquiry by asking people directly and placing their responses beside the inference.
Tell Me How You Feel: ACG carried that comparison into a shared physical environment. The relationship between inferred states and feelings expressed in person became an installation in light.
Tell Me How You Feel: ACGThe comparison continues in shared spaceStudy record
- Context
- New York City’s 2025 mayoral election
- Live setting
- NYC PIT Pop-ups · Public Interest Technology
- Live duration
- Six hours
- Prompt
- How are you feeling right now?
- Response archive
- 27 submissions
- Search archive
- 170 search-trend records · US-NY
The retained search records carry publication dates from October 21 to November 6, 2025. These describe the supplied archive, rather than establishing the exact start and end of the project. The plate titled “14 Days” is a separate visual selection.